National Real Estate Insights | April 2025

National Real Estate Insights | April 2025
This index measures "economic policy uncertainty," which in March soared to its highest level since the pandemic struck. It seems almost certain that the April reading will be higher based on recent macroeconomic developments. 
Stock market changes play a major role in household wealth and consumer confidence, which then impact housing markets. The extreme volatility in stock and other financial markets has shocked investors, analysts and economists.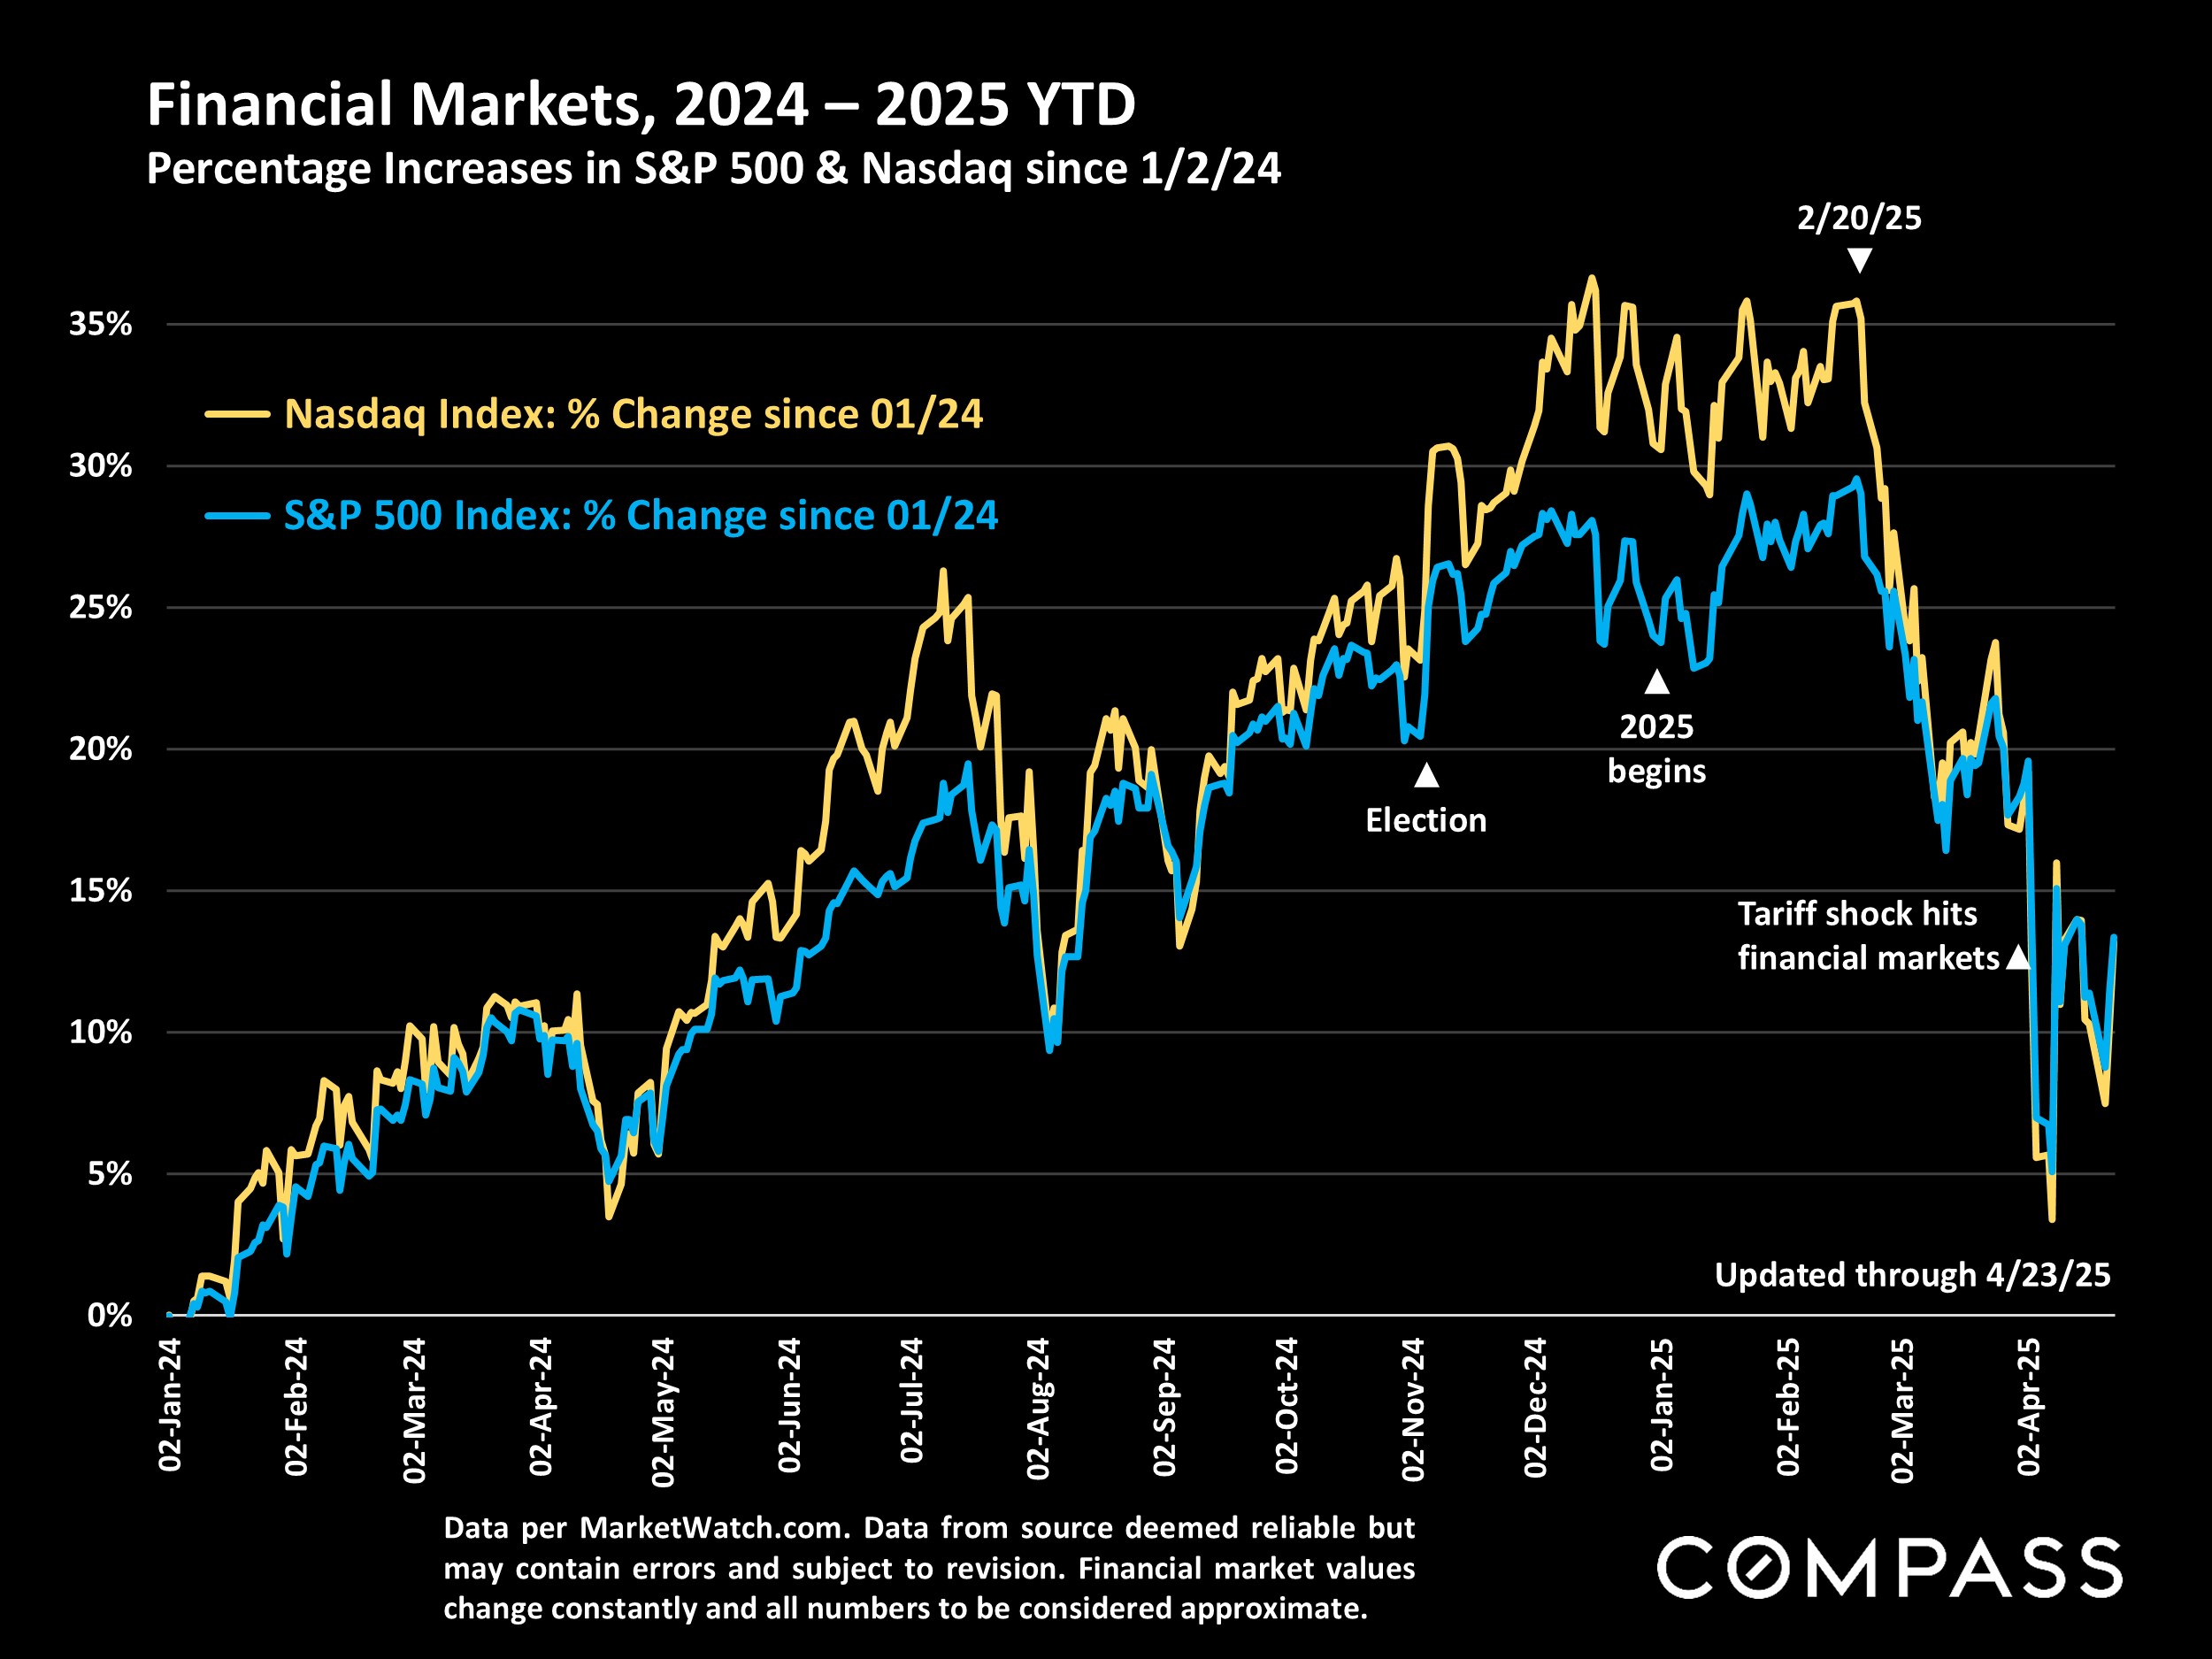
Interest rates initially ticked down in the immediate aftermath of the announcement of unprecedented tariffs in early April, but then jumped as bond markets assessed possible broader ramifications of the new policies coming from Washington. 
Median home sales prices ebb and flow on a seasonal basis, as well as being affected by economic conditions. As illustrated below, they typically hit their annual low points in mid-winter, then climb to peak at the end of the spring. Median prices have continued to rise on a year-over-year basis. 
The number of new listings in March surged higher from February - also a typical seasonal trend - and rose 10% above the March 2024 count. 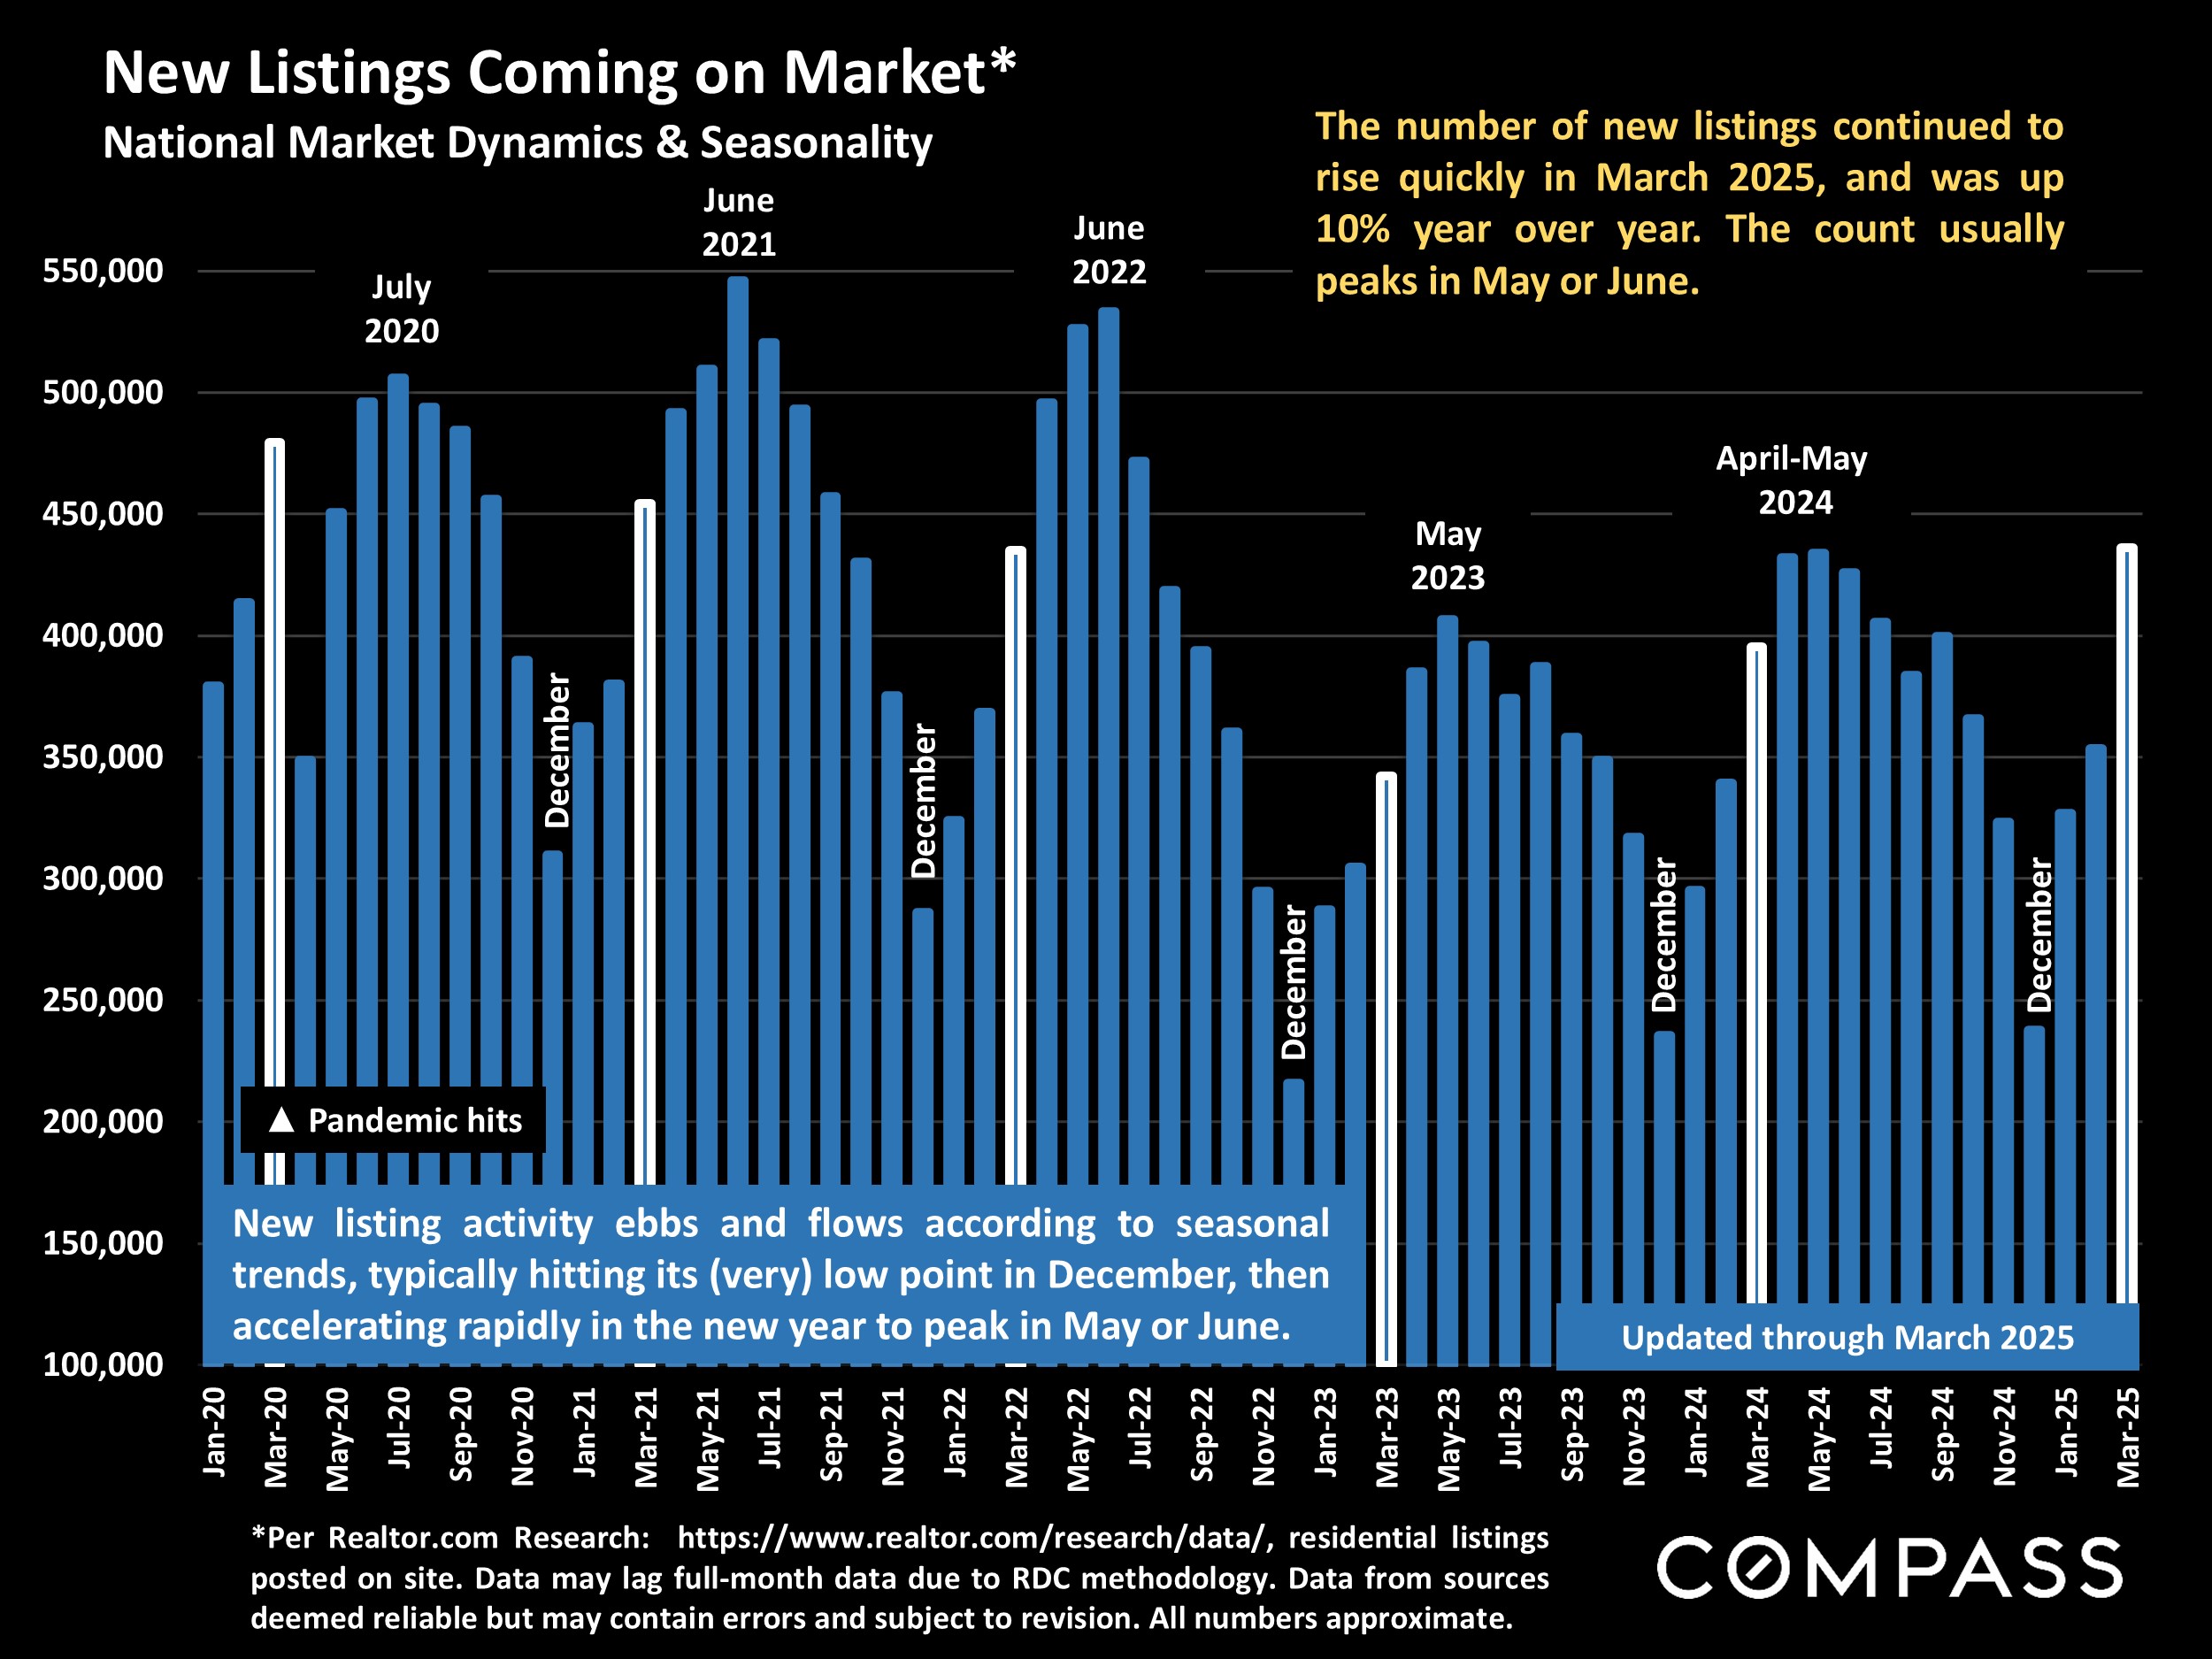
The biggest change in market conditions has been the large increase in the number of homes for sale: Much higher than in the past 4 years, though still well below pre-pandemic norms.
The steady rise in the number of new-construction homes for sale (below) has been even more dramatic than the rise in resale listings (above), another factor in general market dynamics. However, new construction has been most heavily concentrated in southern states such as Texas and Florida, while in many regions they play a relatively negligible role in the supply of homes available for purchase. 
Existing-home sales volume rose from February, but fell on a year-over-year basis: March 2025 saw the lowest number of March sales in 5+ years. 
The pending-sale ratio is a measurement of buyer demand as compared to the supply of homes for sale: The higher the ratio, the more heated the market. Since year-over-year listing numbers have rapidly risen while y-o-y sales volume has flattened or declined, the ratio has fallen substantially from previous years, signifying less competitive market conditions for buyers. 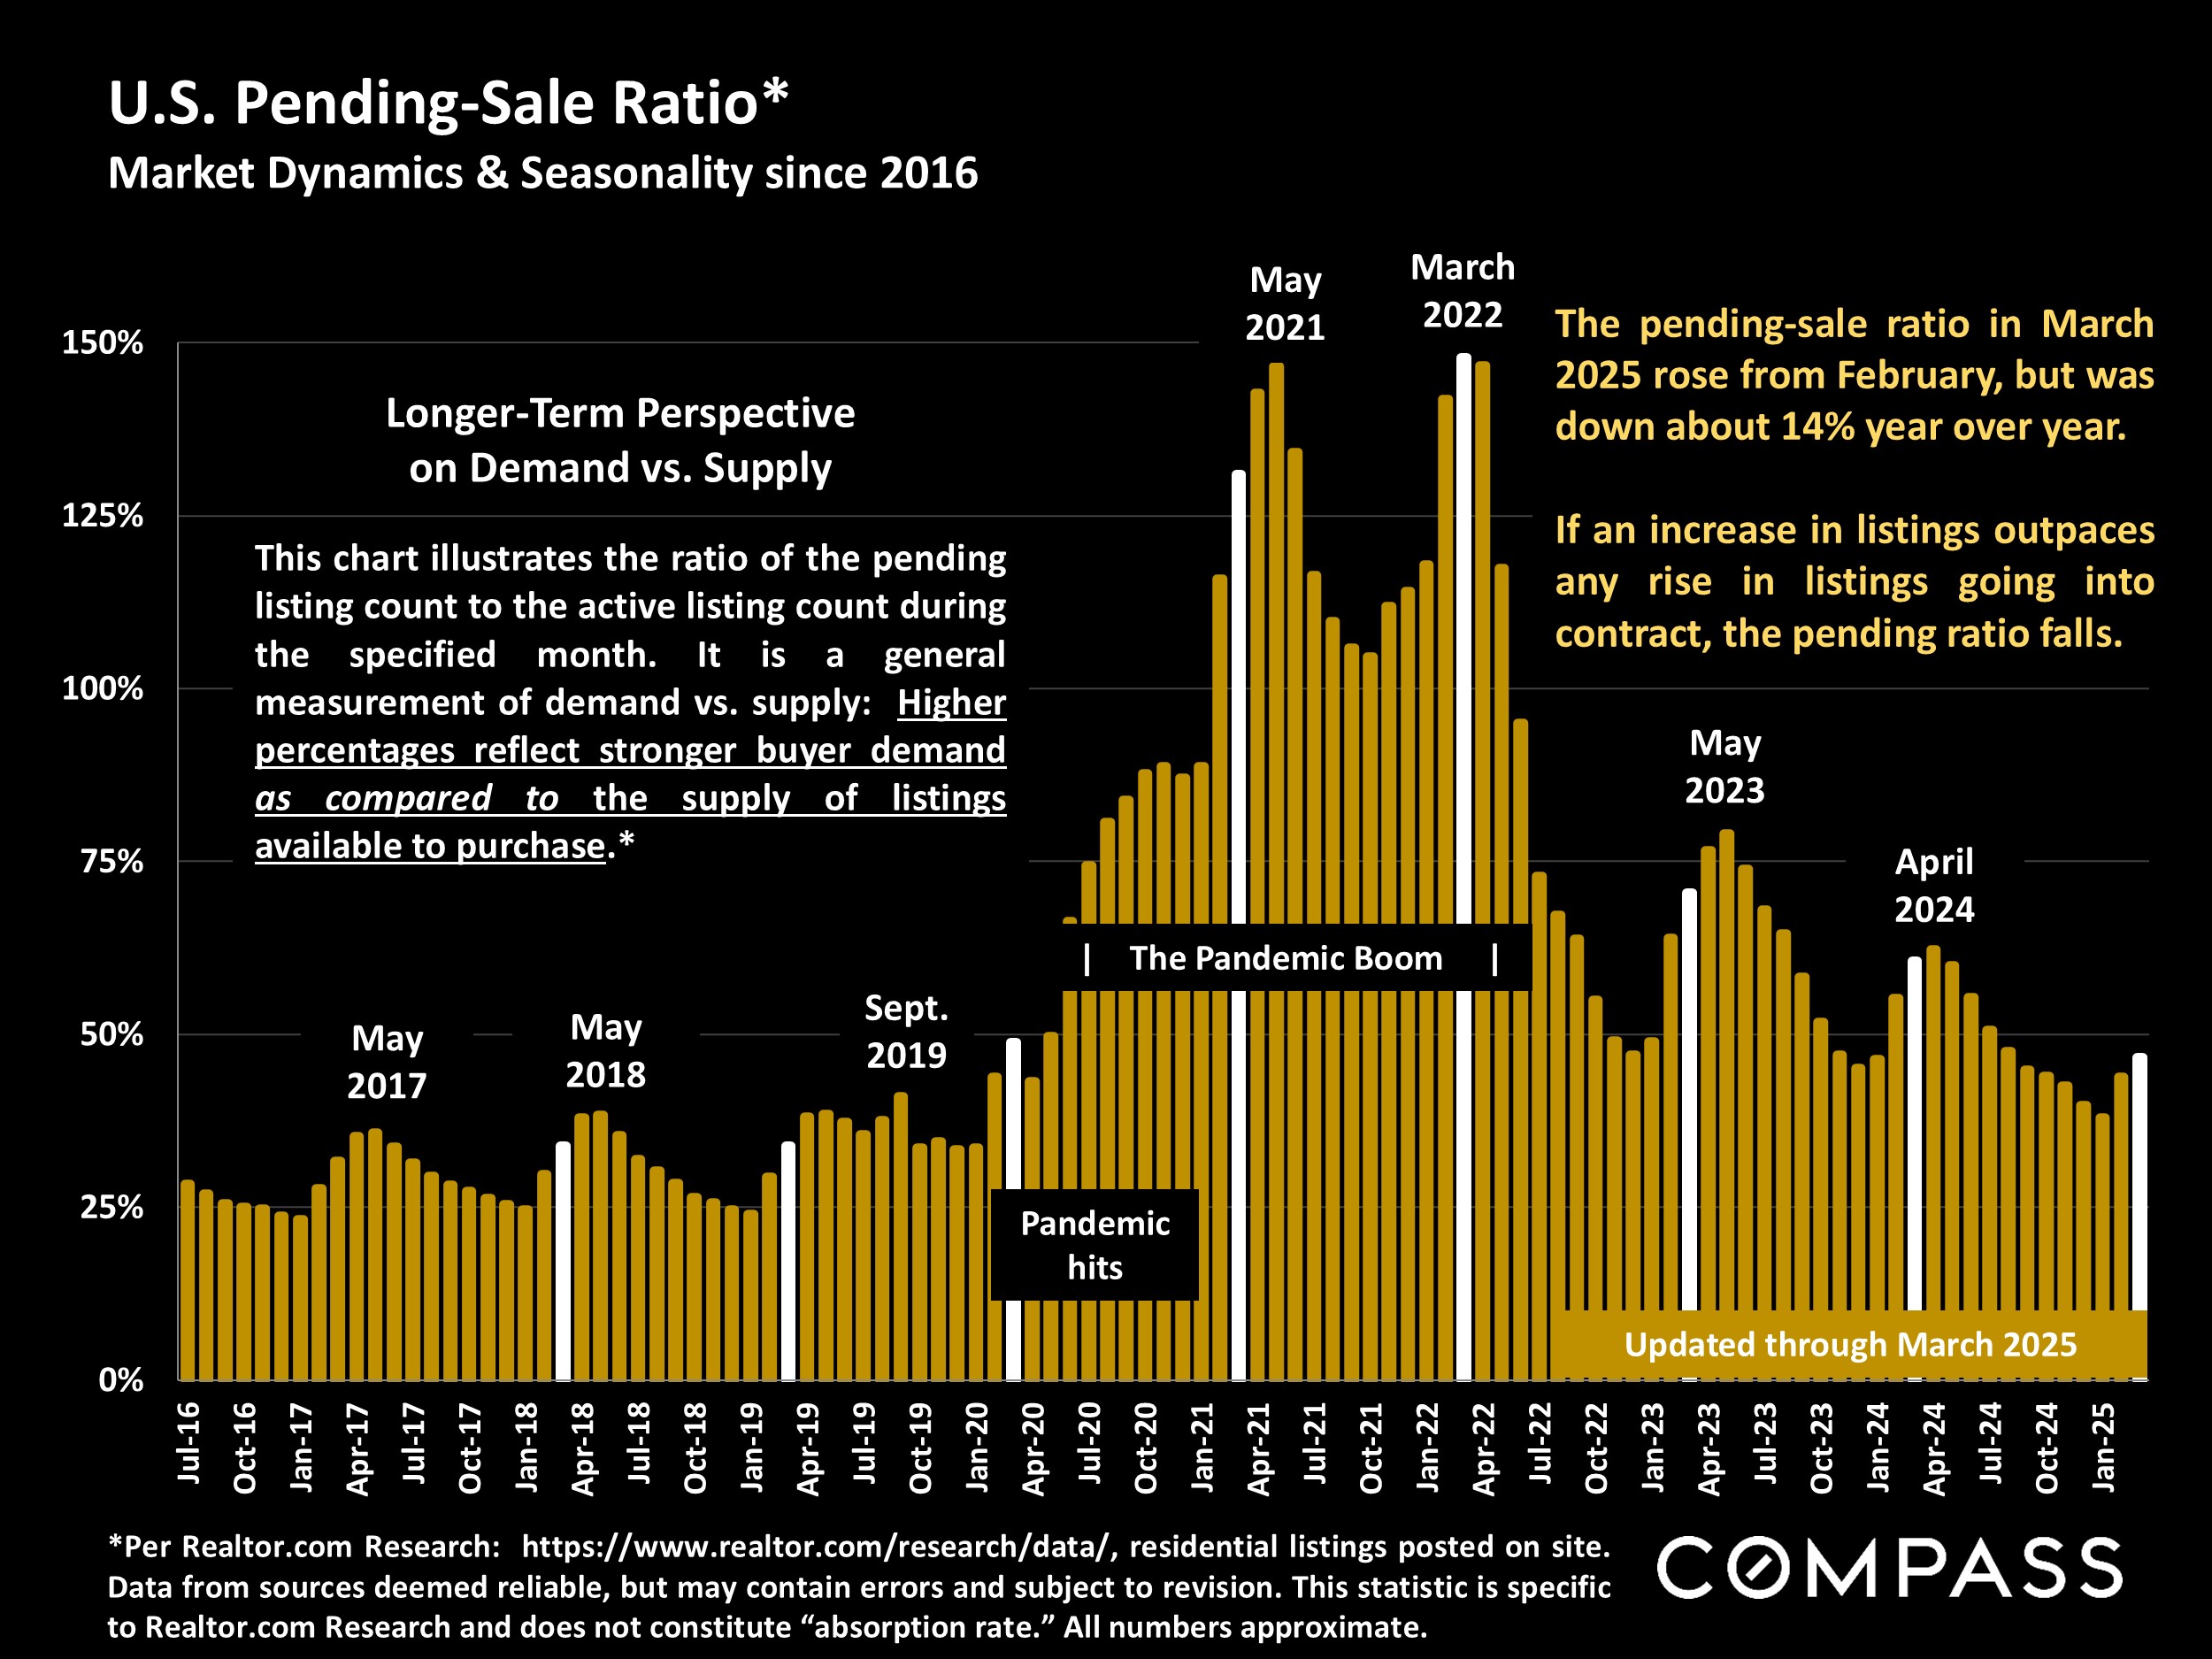
Another sign of market cooling has been the considerable increase in the number of listings reducing asking price. Buyers are well advised to keep a close eye on these homes for possible negotiating opportunities and advantageous deals. 
After the mid-winter slowdown, new listings come to dominate the market in spring, causing time-to-acceptance-of-offer to drop to their annual low. Median days on market were about 10% higher than in March 2024, meaning that listings have been selling somewhat slower than last year. 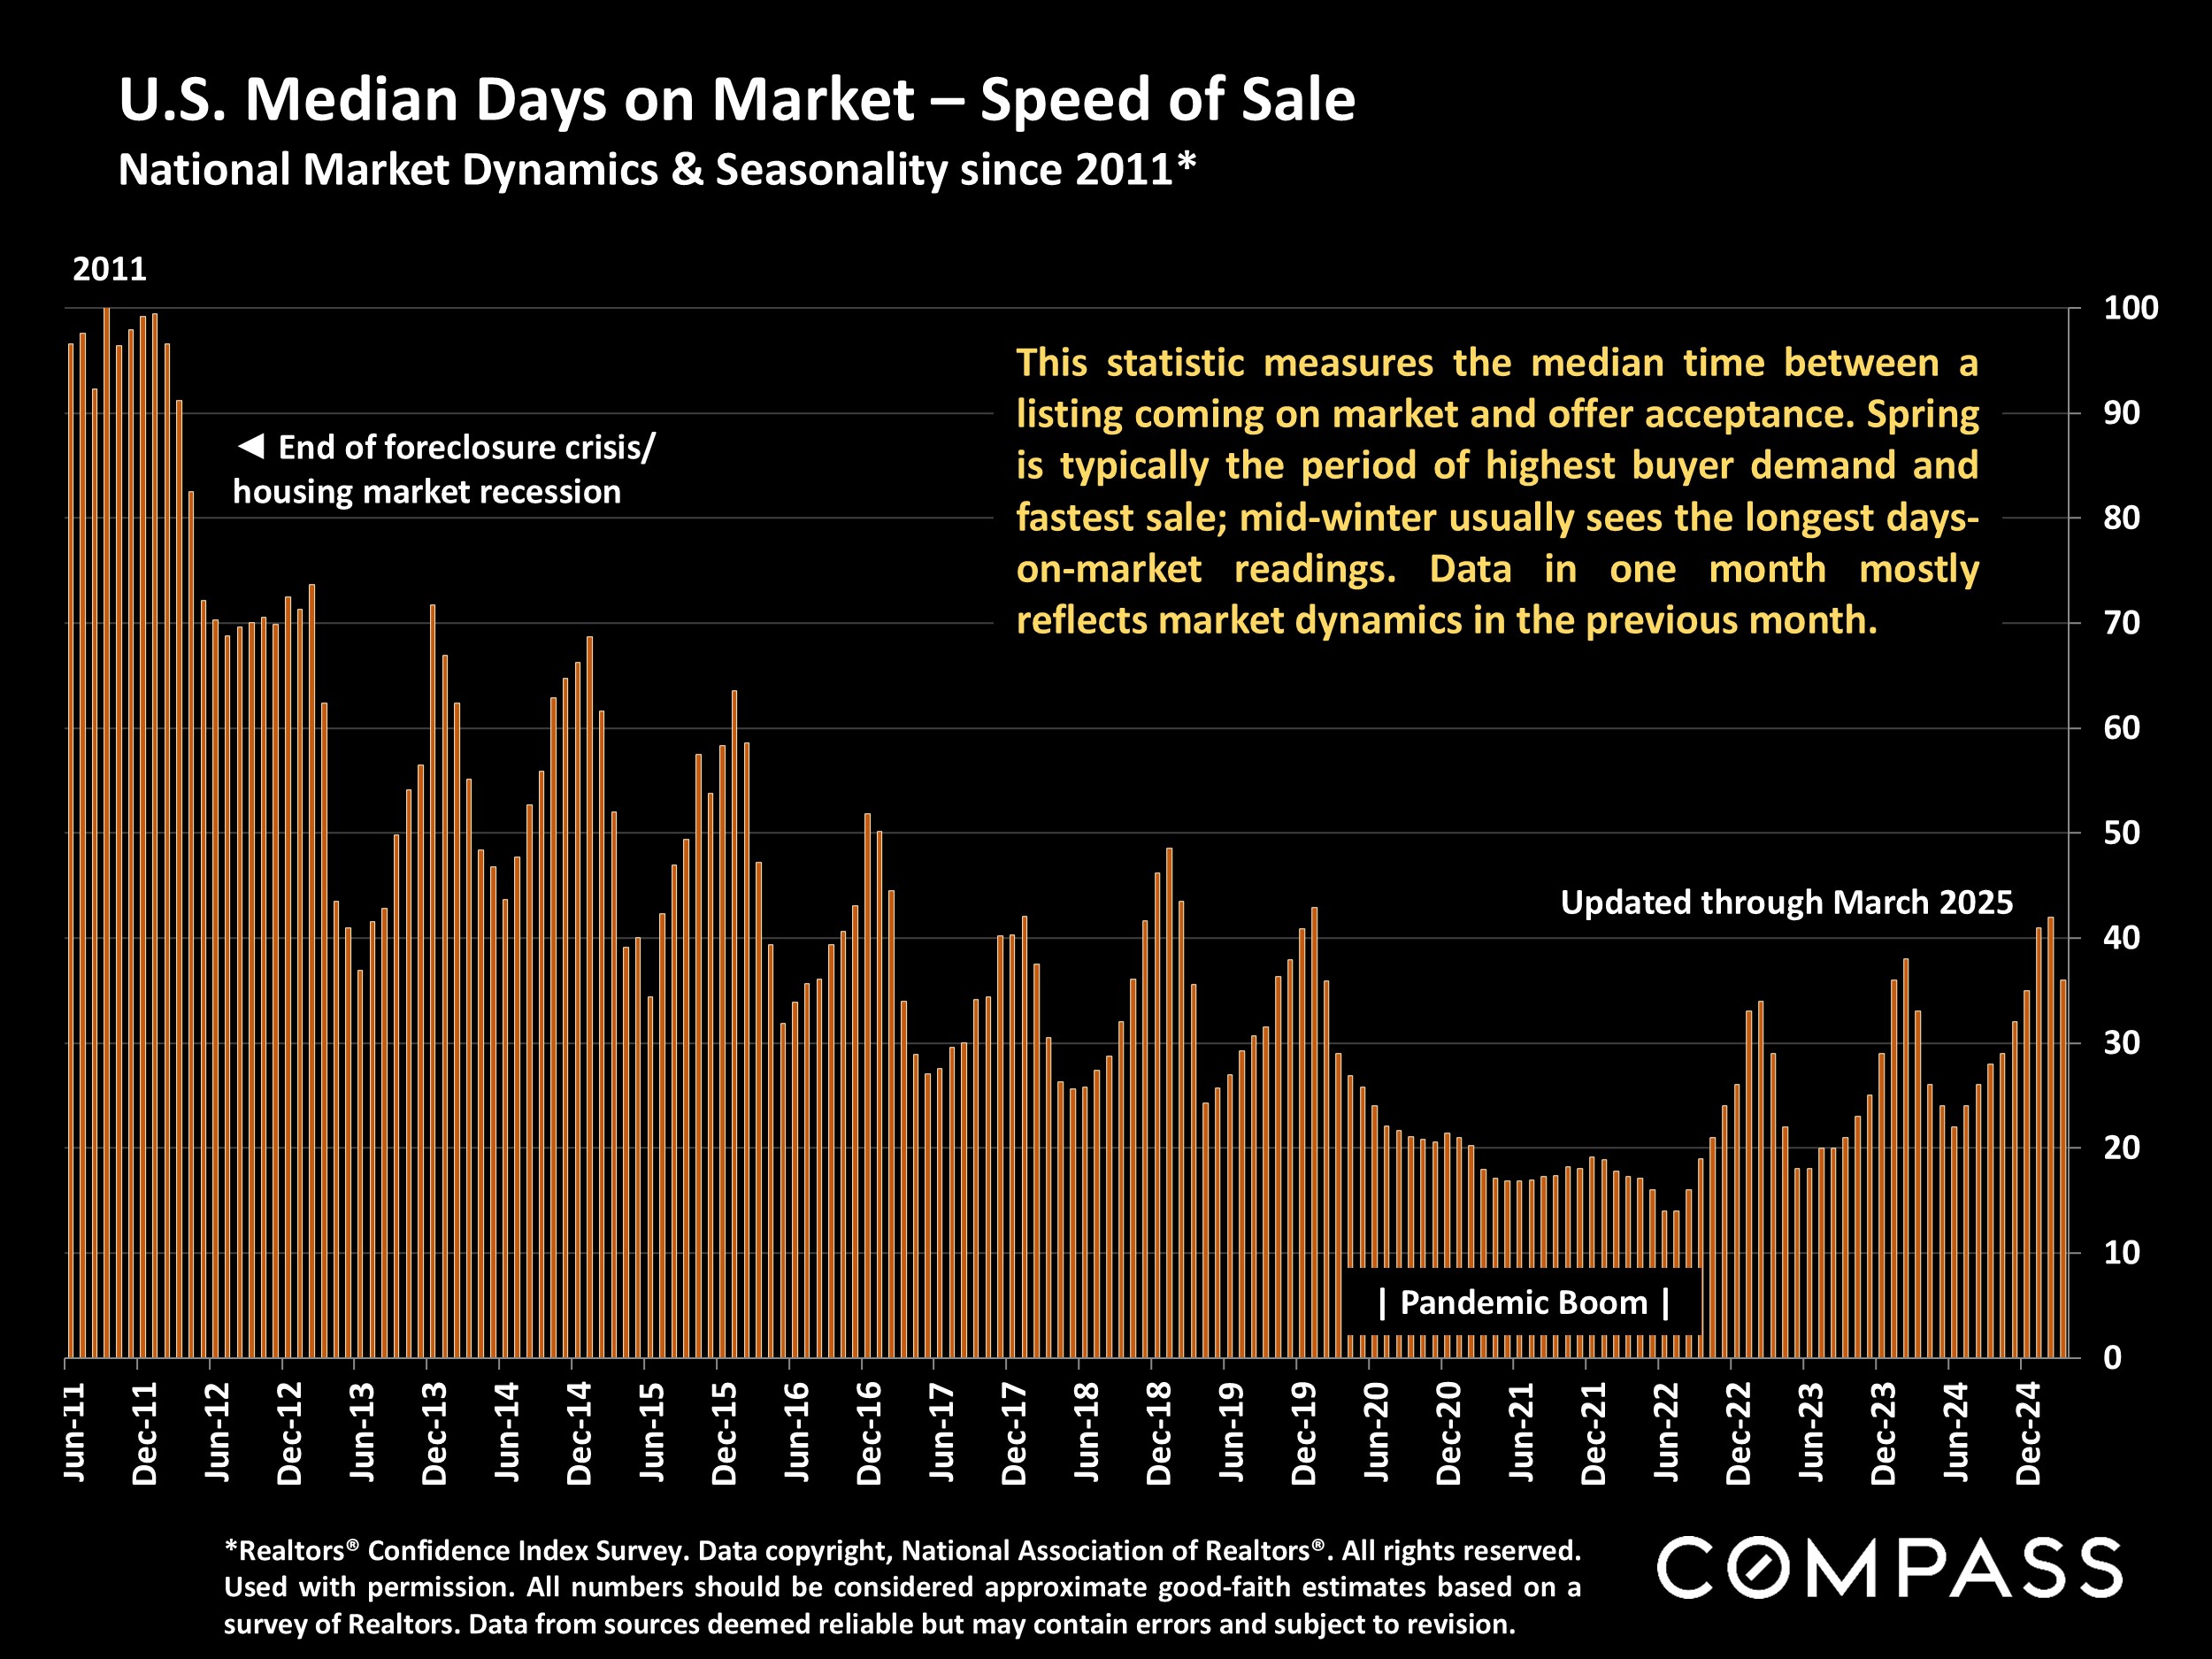
Nationally, owner-occupied homes outnumber tenant-occupied homes almost 2 to 1, but in many major urban centers, renters outnumber homeowners - which can be a significant factor in local politics, especially as pertaining to rent-control laws. And almost a million housing units stand vacant (per Census estimates).
One of the biggest demographic shifts in the past 25 years has been the rapid aging of the U.S. population: The chart below illustrates changes over just the past 4 years. Older homeowners are typically more affluent and move much less often than younger age groups, but then at a certain point retire, downsize, move closer to family, into assisted-living communities, or pass on (often transferring substantial wealth to the next generation). All these changes affect housing markets and some believe a tipping point is approaching as baby boomers age.
National and regional statistics are generalities, essentially summaries generated by thousands of unique, individual listings and sales occurring across different market segments. They are best seen not as precise measurements, but as broad, comparative indicators with reasonable margins of error. Anomalous fluctuations in statistics are not uncommon, and last period data should be considered preliminary estimates which may be revised in future updates. Different analytics programs sometimes define standard statistics differently - such as "active listings," "days on market," and "months supply of inventory": What is most meaningful are not specific numeric calculations but the trends they illustrate. Data from sources deemed reliable, but may contain errors, and subject to revision. All numbers to be considered approximate, and how these analyses apply to any particular property is unknown without a specific comparative market analysis.
----------
Source: compass.com